Data Visualization · Information Design · 2026
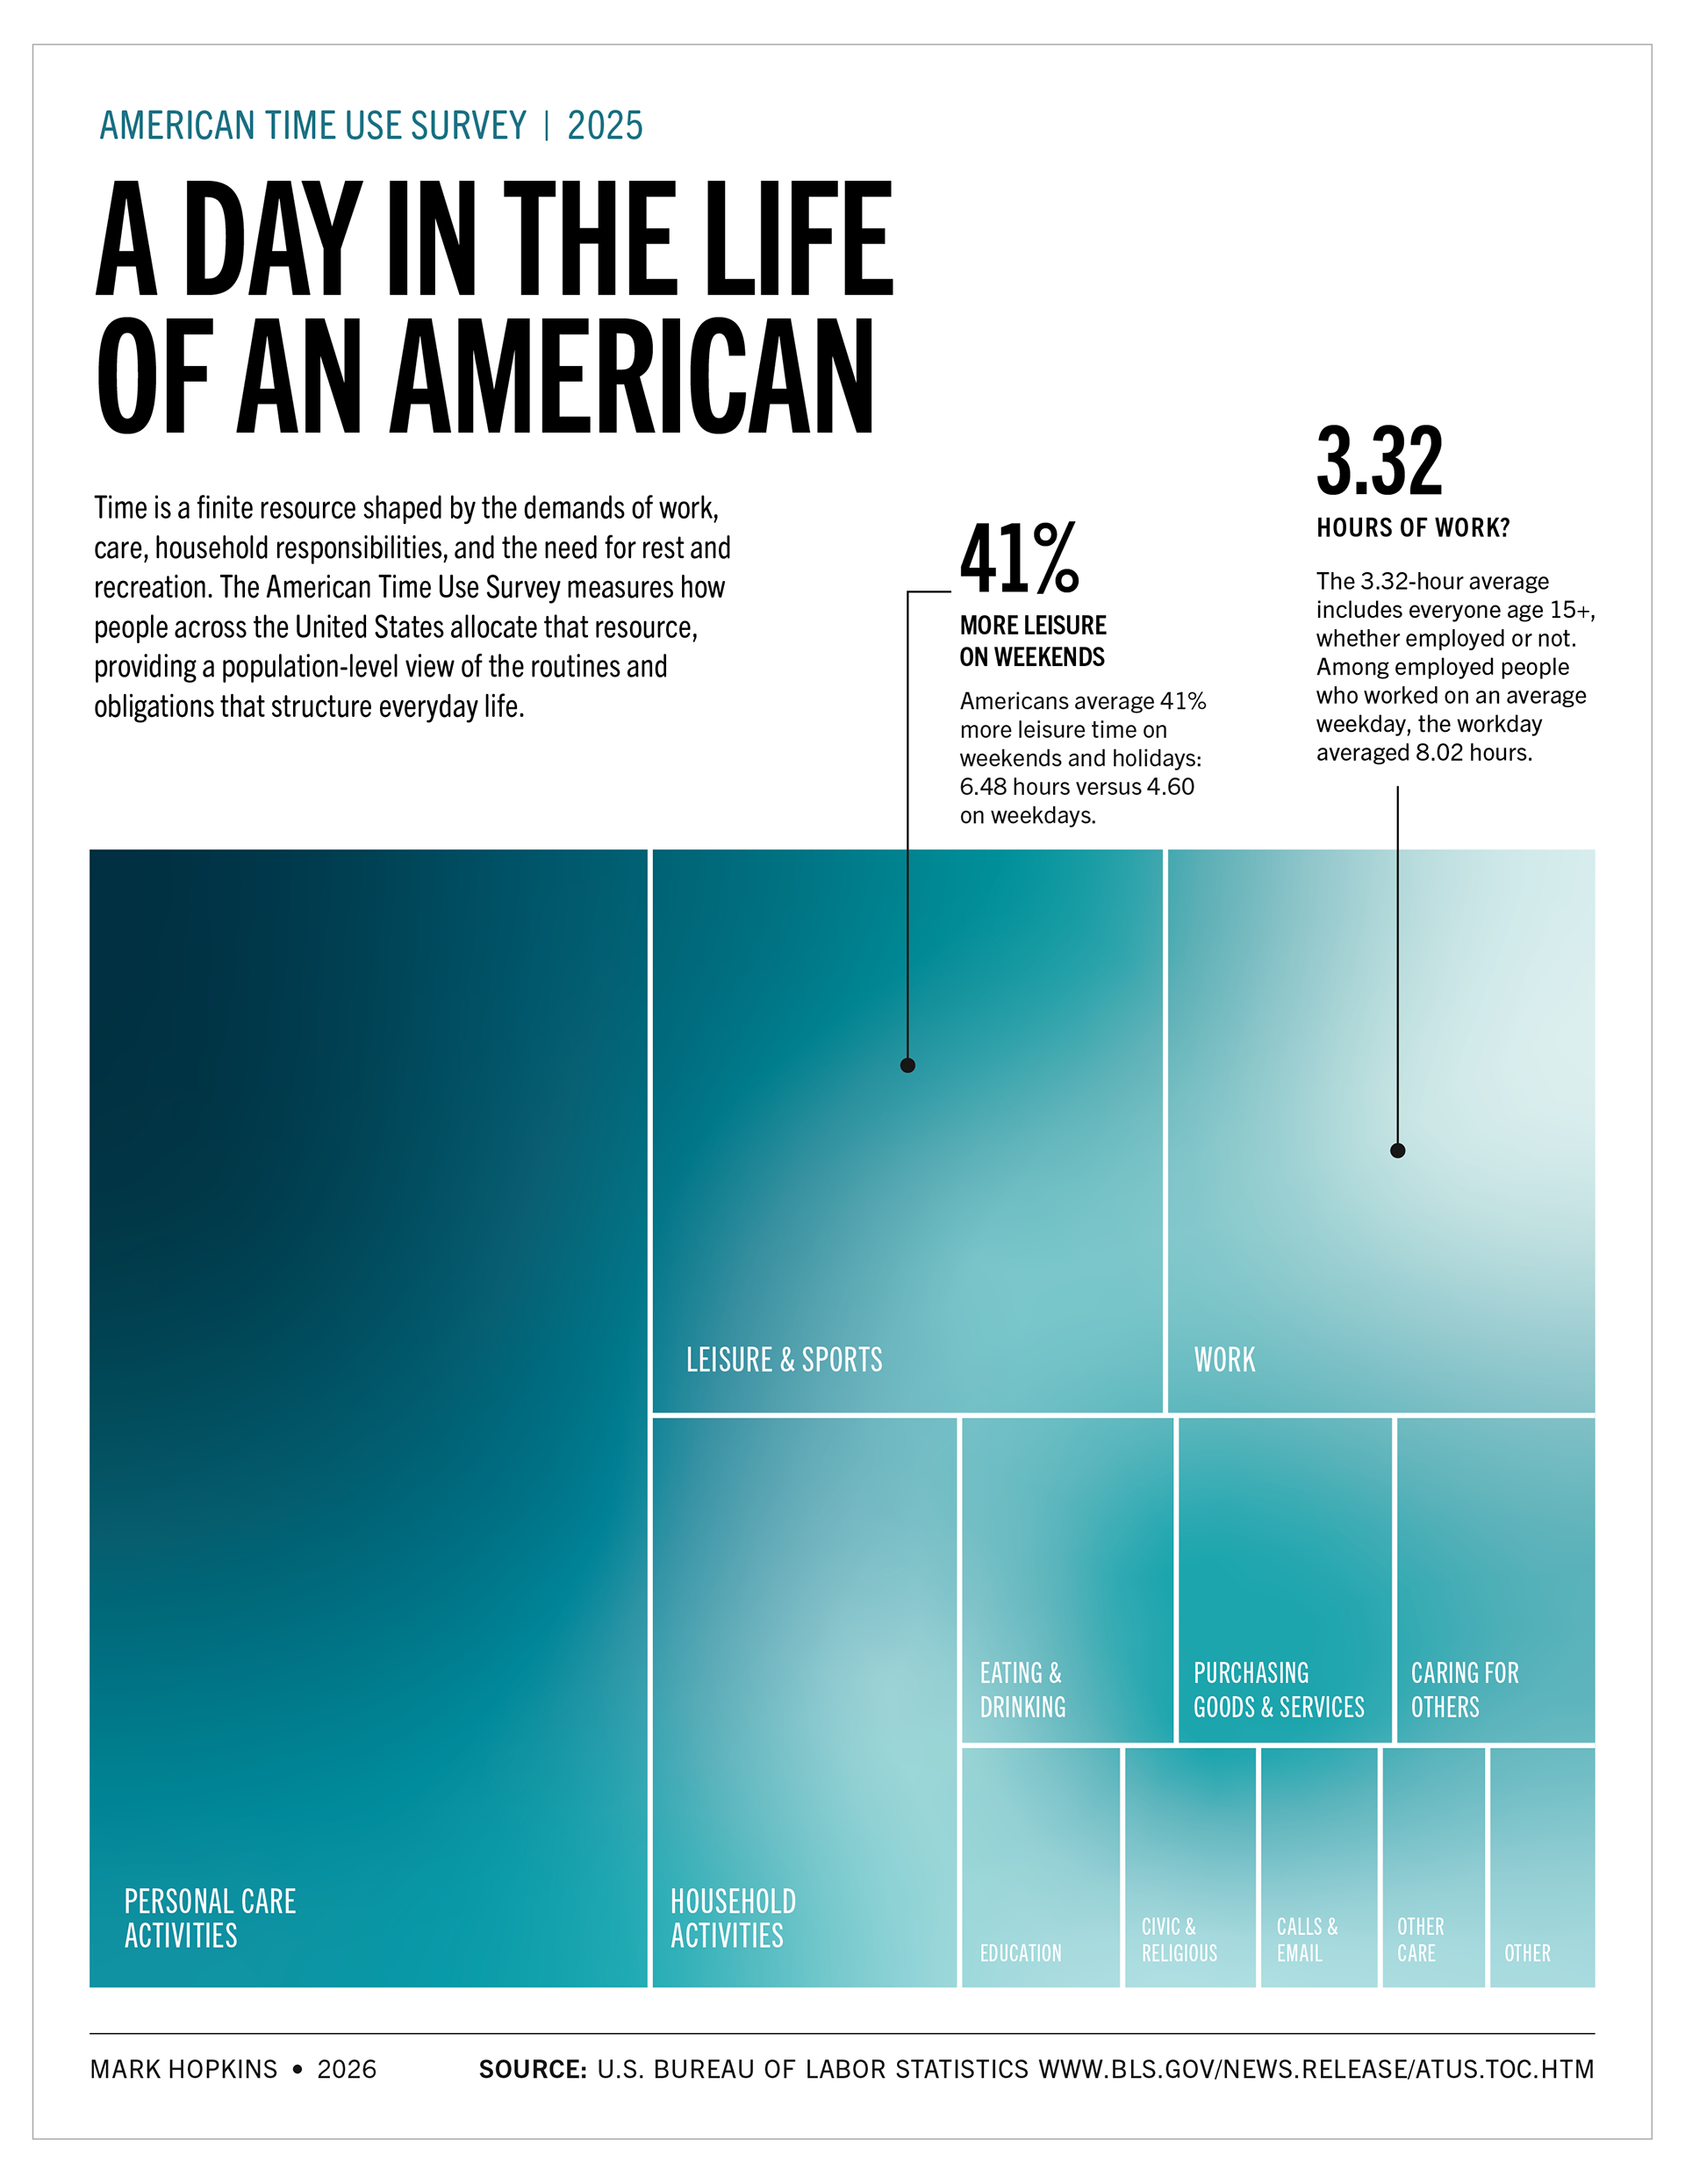
A treemap visualization of 2025 American Time Use Survey data showing how Americans allocate the 24 hours of an average day and how work and leisure averages vary by who is measured and when.
TOOLS: Microsoft Excel · Adobe Illustrator; YEAR: 2026